
Following a notable increase in fire activity in August 2019 and a gradual rise in deforestation, scientists have been watching for signs of how 2020 might shape up. Several worrisome signs have emerged.
In the southern Amazon, the dry season typically begins in July and continues through November, bringing increased fire activity along with it. Following a notable increase in fire activity in August 2019 and a gradual rise in deforestation across multiple years, a team of scientists at NASA and the University of California-Irvine has been watching closely for signs of how the 2020 season might shape up. Several worrisome signs have emerged.
In May and June 2020, warm Atlantic Ocean surface temperatures pointed to a greater risk of drought for key parts of the Amazon rainforest. Satellite-based deforestation tracking systems also have observed large patches of rainforest being razed in recent months, suggesting there is plenty of drying wood primed to burn. Finally, experts have warned that current economic conditions and incentives make land-clearing more likely.
But there is at least one piece of good news: NASA-funded researchers have developed new tools that will make it easier for governments and other stakeholders to understand what types of fires are burning, where they are burning, and how much risk those fires pose to the rainforest. The satellite-driven, web-based tool quickly classifies fires into one of four categories—deforestation, understory fires, small clearing and agricultural fires, and savanna/grassland fires. The tool was made available on the web on August 19, 2020.
Continue reading at NASA Earth Observatory
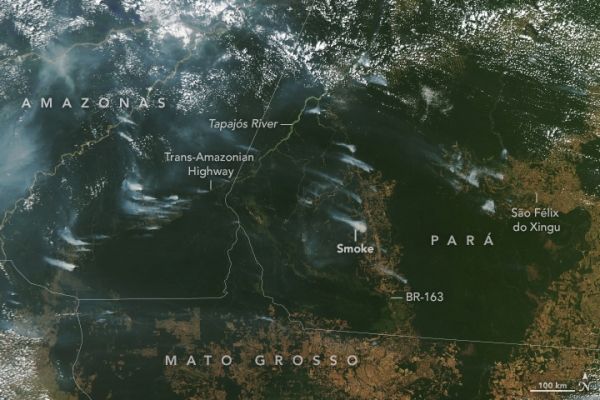
Image via NASA Earth Observatory


