
NASA satellites provided a look at the rainfall potential in Hurricane Sally before and after it made landfall in southern Alabama.
NASA satellites provided a look at the rainfall potential in Hurricane Sally before and after it made landfall in southern Alabama. NASA’s Aqua satellite and IMERG analysis were used to analyze the storm’s flooding potential.
Sally came ashore on Wednesday, Sept. 16 around 5:45 a.m. EDT near Gulf Shores, Alabama. It was a Category 2 storm on the Saffir-Simpson Hurricane Wind scale with sustained winds near 105 mph (169 kph). As a slow-moving storm, Sally generated a lot of rainfall, left behind flooded streets and knocked out power to hundreds of thousands on the U.S. Gulf Coast.
NASA’s Infrared View of Sally
Cloud top temperatures provide information to forecasters about where the strongest storms are located within a tropical cyclone. Tropical cyclones do not always have uniform strength, and some sides are stronger than others. The stronger the storms, the higher they extend into the troposphere, and the colder the cloud top temperatures. NASA provides that data to forecasters at NOAA’s National Hurricane Center or NHC so they can incorporate it in their forecasting.
Read more at NASA/Goddard Space Flight Center
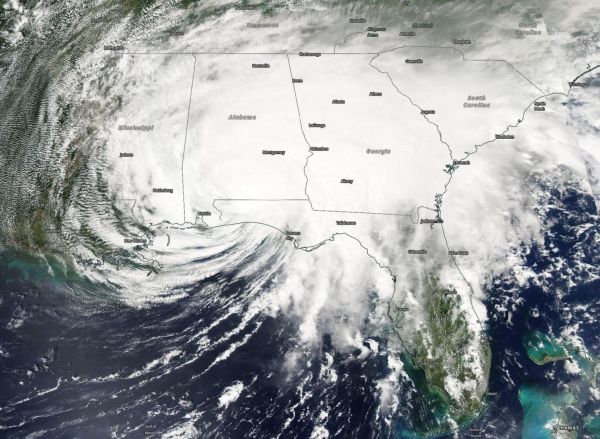
Image: NASA's Aqua satellite provided a visible image of Sally at 1:30 p.m. EDT on Sept. 16 about 8 hours after landfall in southern Alabama. Sally then continued a slow trek through Alabama. (Credit: NASA Worldview, Earth Observing System Data and Information System (EOSDIS))


