
Typhoon Chan-hom was still moving parallel to Japan’s east coast as NASA’s satellite rainfall product, that incorporates data from satellites and observations, showed its heaviest rainfall was pushed northeast of center.
Typhoon Chan-hom was still moving parallel to Japan’s east coast as NASA’s satellite rainfall product, that incorporates data from satellites and observations, showed its heaviest rainfall was pushed northeast of center.
Chan-hom’s Status on Oct. 9
At 5 a.m. EDT (0900 UTC), the center of Chan-hom was located near latitude 30.9 degrees north and longitude 133.9 degrees east. That is approximately 413 nautical miles southwest of Yokosuka, Japan. Chan-hom was moving to the north-northeast. Maximum sustained winds are near 70 knots (81 mph/130 kph).
Estimating Chan-hom’s Rainfall Rates from Space
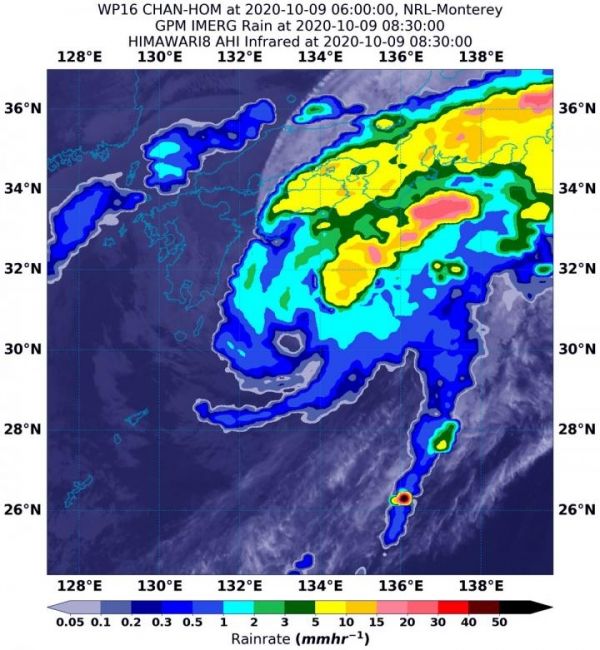
NASA’s Integrated Multi-satellitE Retrievals for GPM or IMERG, which is a NASA satellite rainfall product, estimated Chan-hom’s rainfall rates on Oct. 9 at 4:30 a.m. EDT (0830 UTC).
Wind shear, outside winds at different speeds and directions that can adversely affect a tropical cyclone, were pushing Chan-hom’s heaviest rainfall northeast of the center. Chan-hom was generating as much as 30 mm (1.18 inches) of rain per hour just northeast of the center of circulation. Rainfall rates in storms surrounding those areas of heaviest rainfall were estimated as falling at a rate between 5 and 15 mm (0.2 to 0.6 inches) per hour. On the southwestern side of the center, rainfall rates were occurring between 0.1 and 1 mm (0.003 and 0.03 inches) per hour.
Read more at NASA/Goddard Space Flight Center
Image: On Oct. 9 at 4:30 a.m. EDT (0830 UTC), NASA's IMERG estimated Chan-hom was generating as much as 30 mm inches of rain (1.18 [dark pink]) just northeast of the center of circulation. Rainfall rates in storms surrounding those areas of heaviest (yellow and green colors) rainfall, were estimated to be falling at a rate between 5 and 15 mm (0.2 to 0.6 inches) per hour. On the southwestern side of the center, rainfall rates were occurring between 0.1 and 1 mm (0.003 and 0.03 inches) per hour. The rainfall data was overlaid on infrared imagery from NOAA's GOES-16 satellite. (Credit: NASA/NOAA/NRL)


