
For decades, scientists have been warning about potential future effects of global climate change, including more frequent wildfires, longer periods of drought, and sharp increases in the number, duration, and intensity of tropical storms.
For decades, scientists have been warning about potential future effects of global climate change, including more frequent wildfires, longer periods of drought, and sharp increases in the number, duration, and intensity of tropical storms. And since the start of 2020, we’ve seen natural disasters in record-breaking numbers, from the wildfires that ravaged California and Colorado, to most consecutive days with temperatures skyrocketing over 100 degrees in places like Arizona. Environmental concerns are continually creeping to a broader, national stage: issues of climate change and conservation received more attention during the first presidential debate on September 29, 2020 than in any other presidential debate in history.
But when it comes to the topic of safeguarding the environment, Boston University Earth & Environment Assistant Professor Christoph Nolte is hardly a newcomer. He’s spent the majority of his academic career studying the effectiveness of conservation, asking key questions about where concerted efforts take place, and what difference they make for our world at large. To inform future decisions about conservation policy, Assistant Professor Nolte has now created the first high-resolution map of land value in the United states — a tool he says will better estimate environmental conservation costs, inform policy recommendations, and help peer academics conduct their own research on rebuilding and protecting what’s left of our natural resources and the biodiversity within our ecosystems. We sat down with him to learn more.
You’ve created the first high-resolution map of U.S. land value. What spurred this research?
Read more at Boston University
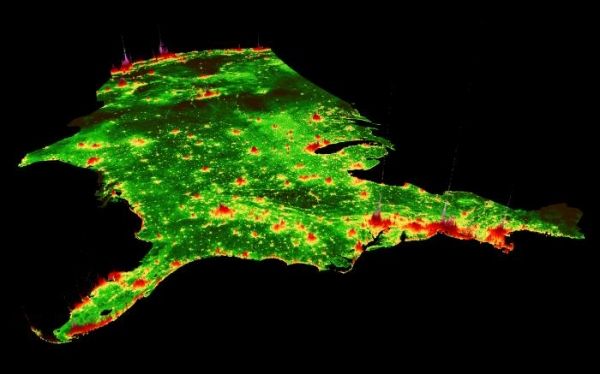
Image: Estimated fair market value of all properties in the United States (3D visualization). (Credit: Photo courtesy of Christoph Nolte, Boston University.)


