
Trees are often heralded as the heroes of environmental mitigation. They remove carbon dioxide from the atmosphere, which slows the pace of climate change, and sequester nutrients such as nitrogen, which improves water and air quality.
Trees are often heralded as the heroes of environmental mitigation. They remove carbon dioxide from the atmosphere, which slows the pace of climate change, and sequester nutrients such as nitrogen, which improves water and air quality. Not all tree species, however, perform these services similarly, and some of the strongest impacts that trees have on ecosystems occur below the surface, away from the eyes of observers. This complicates efforts to predict what will happen as tree species shift owing to pests, pathogens, and climate change as well as to predict which species are most beneficial in reforestation efforts.
For years, researchers have sought to understand how and why forests comprised of different mixtures of tree species differ in their functioning. Because of the large number of species on Earth, it is impractical to study each tree species’ unique effects on carbon and nutrient cycling. Rather, there has been a push to classify trees into groups to help us predict the consequences of tree species shifts.
Researchers at Indiana University—in collaboration with scientists from West Virginia University, Jet Propulsion Laboratory, the University of Virginia, and the University of Warwick—have found that classifying temperate forest trees based on the type of symbiotic fungi with which the trees associate can serve as a broad indicator of how the trees and forests function.
Read more: Indiana University Bloomington
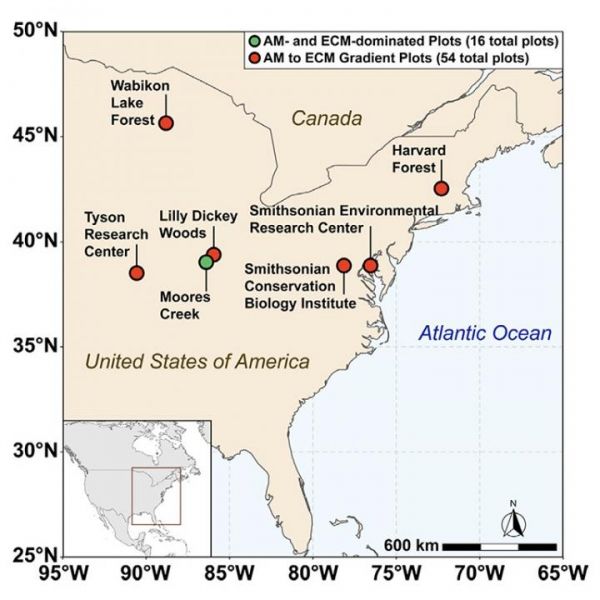
A map of sampling locations across the eastern United States used in the studies. The green dot indicates Moores Creek where AM and ECM dominated plots are located while the red dots indicate sites associated with the 54-plot gradient. The Moores Creek site contains 16 total plots (8-AM and 8-ECM dominated) while each site in the 54-plot gradient contains nine plots of varying AM/ECM composition. (Photo Credit: Graphic by Mushinski, et al.)


