
A recent analysis of the latest generation of climate models — known as a CMIP6 — provides a cautionary tale on interpreting climate simulations as scientists develop more sensitive and sophisticated projections of how the Earth will respond to increasing levels of carbon dioxide in the atmosphere.
A recent analysis of the latest generation of climate models — known as a CMIP6 — provides a cautionary tale on interpreting climate simulations as scientists develop more sensitive and sophisticated projections of how the Earth will respond to increasing levels of carbon dioxide in the atmosphere.
Researchers at Princeton University and the University of Miami reported that newer models with a high “climate sensitivity” — meaning they predict much greater global warming from the same levels of atmospheric carbon dioxide as other models — do not provide a plausible scenario of Earth’s future climate.
Those models overstate the global cooling effect that arises from interactions between clouds and aerosols and project that clouds will moderate greenhouse gas-induced warming — particularly in the northern hemisphere — much more than climate records show actually happens, the researchers reported in the journal Geophysical Research Letters.
Instead, the researchers found that models with lower climate sensitivity are more consistent with observed differences in temperature between the northern and southern hemispheres, and, thus, are more accurate depictions of projected climate change than the newer models. The study was supported by the Carbon Mitigation Initiative (CMI) based in Princeton’s High Meadows Environmental Institute (HMEI).
Read more at Princeton University
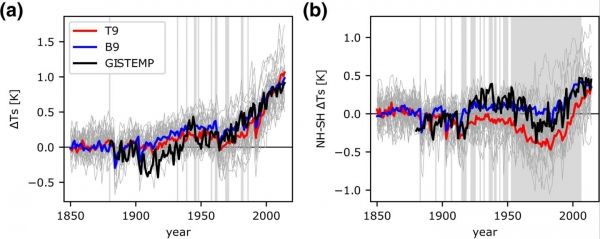
Image: The researchers found that models with lower climate sensitivity are more consistent with observed temperature differences, particularly between the northern and southern hemispheres. The graph shows changes in the annual global-mean surface temperature (a) and the temperature difference between the northern and southern hemispheres (b) from 1850 to 2000. The red line represent high climate-sensitivity models, while the blue line represents models with low climate sensitivity. The black line shows observed temperature fluctuations collected by NASA's Goddard Institute for Space Studies Surface Temperature Analysis project, which more closely follow the blue line when it comes to interhemispheric temperature. The gray backgrounds indicate years when the difference between the high and low climate-sensitivity models are significant. (Credit: Image by Chenggong Wang, Program in Atmospheric and Oceanic Sciences, Princeton University)


