
Apps and websites like eBird and iNaturalist encourage members of the public to report their observations on everything from songbird migration patterns to the presence of new planets.
Apps and websites like eBird and iNaturalist encourage members of the public to report their observations on everything from songbird migration patterns to the presence of new planets. The result is massive datasets that far outmatch what professionally trained scientists could collect, at least in terms of quantity. However biases in the quality of data collected by “citizen scientists” sometimes prevent it from being used to address foundational scientific questions.
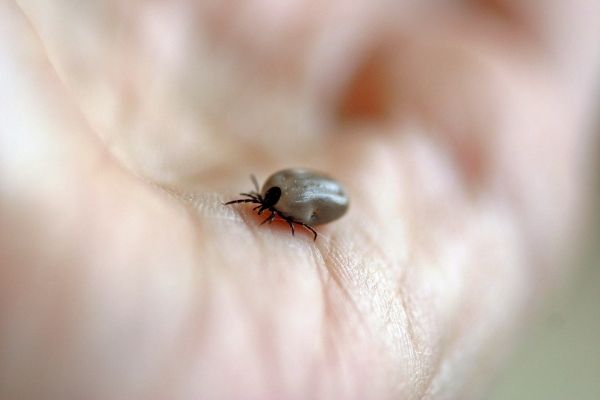
A new study led by Tam Tran, who earned her doctoral degree working with Dustin Brisson of Penn’s Department of Biology in the School of Arts & Sciences, taps into this wealth of citizen science data, identifying a strategy for correcting its biases to increase its value to science. Tran and colleagues applied this method to a large dataset documenting Ixodes scapularis, the black-legged tick, the vector of Lyme disease. The result is the most comprehensive look to date at the tick’s distribution across the northeastern United States.
They shared their findings in the Journal of the Royal Society Interface.
“Normally with citizen science data you can validate it by controlling for characteristics that describe the collector: their level of education, their experience collecting, and so on,” says Tran, who is now completing her medical degree at Virginia Commonwealth University. “But we didn’t have that data. Instead we found we could use county-level data on demographics and a few other factors to successfully correct the biases in this data. Doing that, we were able to create currently the most updated map of tick abundance across the Northeast.”
Read more at University of Pennsylvania
Photo Credit: Catkin via Pixabay


