
Two years ago, an initial study of global snow cover announced how in 78 percent of mountain areas, snowfall had declined over the past 20 years.
Two years ago, an initial study of global snow cover announced how in 78 percent of mountain areas, snowfall had declined over the past 20 years. To bolster these observations, the same author has now extended the start of data collection to 1982, thus covering a 38-year period up to 2020. "Unfortunately, there are no denials of these trends, only confirmations," explains Claudia Notarnicola, physicist, deputy director of Eurac Research's Institute for Earth Observation and sole author of the study. "With a few exceptions, data on both the extent and duration of snow cover are clearly decreasing." Specifically, there are on average, 15 fewer days that snow remains on the ground, with peaks of 20 or even 30 fewer days in Canada's western provinces (dark orange, figure 1). Coverage has decreased by a total of four percent, which when multiplied by the extent of the areas affected by negative trends (yellow, figure 2) presents an alarming dataset.
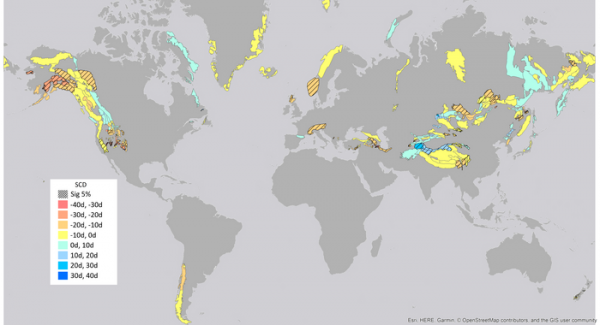
The few existing counter-trend figures are hardly encouraging. For example, in the early 1980s, the eruption of Mexico's El Chichon volcano caused a slight cooling that counteracted the decrease in snowfall, but this phenomenon has not lasted long. "In general, over these 38 years of analysis there are also some cases of increases in both coverage and snow days (blue, figure 2). Specifically in parts of Central Asia and some valleys in the United States. In fact, so much so that Donald Trump has often referred to the intense snowfalls the US in his tweets as a means of denying climate change," Notarnicola continues. "There are no consensus explanations for these phenomena, but they could be other effects of climate change, for example variations in currents and winds or specific microclimatic conditions. In any case, these are a few exceptions in a very negative global context."
Read more at: Eurac Research
The variation is given in days per year. The first entry, "sig. 5 percent," indicates the statistical confidence level - the reliability of the calculated trends. It means that there is only a 5 percent probability that the data will follow those developments by chance only. (Photo Credit: Claudia Notarnicola / Eurac Research)


