
A fifth of neighborhood blocks in the continental United States most vulnerable to natural disaster account for a quarter of the lower 48 states’ risk, according to a detailed assessment of vulnerability.
A fifth of neighborhood blocks in the continental United States most vulnerable to natural disaster account for a quarter of the lower 48 states’ risk, according to a detailed assessment of vulnerability.
Leaders in data-driven risk modeling, researchers at The University of Alabama used advanced data analysis and machine learning of more than 100 factors that influence vulnerability to natural hazards for about 11 million United States Census Bureau blocks, finding significant differences can exist between neighboring blocks.
The result published in the journal Nature Communications is the first mapping of the continental U.S.’s exposure to impacts from natural hazards at the block level, overcoming the limitations of previous efforts to define and assess vulnerability at larger scales that can hide local variability.
Read more at: University of Alabama
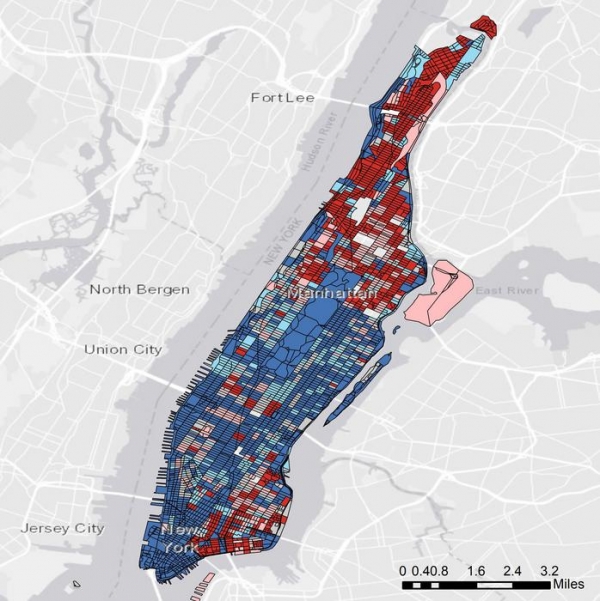
The SEIV index for Manhattan in New York City is shown on the map as a spectrum of colors from the darkest blue as very low vulnerability to the darkest red as very high vulnerability. (Photo Credits: University of Alabama Center for Complex Hydrosystems Research)


