
Tracking climate behavior could connect the dots between major weather events and help with forecasting on a global scale.
Tracking climate behavior could connect the dots between major weather events and help with forecasting on a global scale.
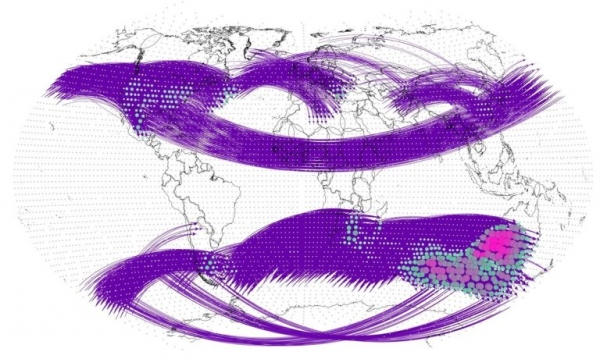
Climate change and the rapid increase in frequency of extreme weather events around the globe – such as wildfires and floods – reinforces the reality that these events are not only not random but, rather, interconnected. Interlinked climate behavior, or teleconnections, isn’t a well understood field but will be necessary to fully comprehend how our climate system works.
In Chaos, from AIP Publishing, a team of researchers affiliated with Beijing Normal University and Beijing University of Posts and Telecommunications in China and the Potsdam Institute for Climate Impact Research in Germany describes a climate network analysis method to explore the intensity, distribution, and evolution of teleconnections.
“Teleconnections describe how climate events in one part of the world can affect weather thousands of kilometers away,” said co-author Jingfang Fan of Beijing Normal University and the Potsdam Institute for Climate Impact Research. “Think of it as a domino effect on a global scale.”
Read more at American Institute of Physics
Image: The structure of teleconnections as depicted within the climate network. (Credit: Shang Wang, Jun Meng, and Jingfang Fan)


