
In recent decades, scientists have noted a surge in Arctic plant growth as a symptom of climate change. But without observations showing exactly when and where vegetation has bloomed as the world’s coldest areas warm, it’s difficult to predict how vegetation will respond to future warming. Now, researchers at the U.S. Department of Energy’s Lawrence Berkeley National Laboratory (Berkeley Lab) and UC Berkeley have developed a new approach that may paint a more accurate picture of Arctic vegetation and our climate’s recent past – and future.
In recent decades, scientists have noted a surge in Arctic plant growth as a symptom of climate change. But without observations showing exactly when and where vegetation has bloomed as the world’s coldest areas warm, it’s difficult to predict how vegetation will respond to future warming. Now, researchers at the U.S. Department of Energy’s Lawrence Berkeley National Laboratory (Berkeley Lab) and UC Berkeley have developed a new approach that may paint a more accurate picture of Arctic vegetation and our climate’s recent past – and future.
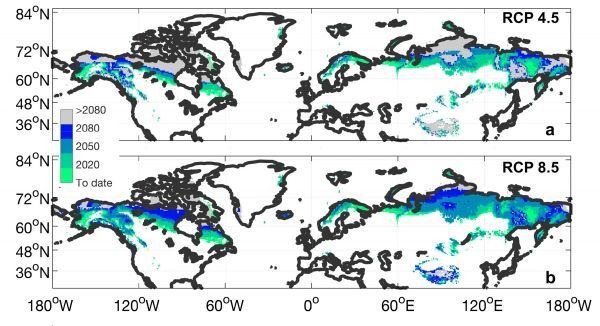
In a study published online Aug. 20 in Nature Climate Change, the researchers used satellite images taken over the past 30 years to track – down to a pixel representing approximately 25 square miles – the ebb and flow of plant growth in cold areas of the northern hemisphere, such as Alaska, the Arctic region of Canada, and the Tibetan Plateau.
The 30-year historic satellite data used in the study were collected by the National Oceanic and Atmospheric Administration’s Advanced Very High Resolution Radiometer. The data was processed by Boston University, and is hosted on NEX – the NASA Earth Exchange data archive.
Read more at DOE / Lawrence Berkeley National Laboratory
Image: Current and predicted changes in areas around the world where vegetation responds strongly to warming. Shaded areas represent areas where vegetation growth was limited by cold temperatures at the start of the observational record (1982-1986) but was not by the corresponding year. Representative Concentration Pathway (RCP) 4.5 is a carbon emissions target to limit temperature increases to 2 degrees Celsius, while RCP 8.5 represents a scenario where carbon emissions are not limited, and temperature increases exceed 2 degrees Celsius. (CREDIT: Trevor Keenan and William Riley / Berkeley Lab)


