
A new online platform that allows for the tracking of air pollution worldwide is now available to the public.
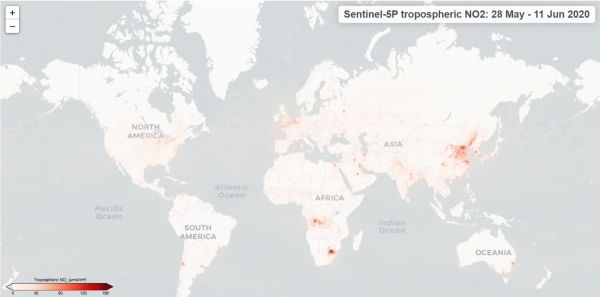
The maps, which use data from the Copernicus Sentinel-5P satellite, show the averaged nitrogen dioxide concentrations using a 14-day moving average. The maps not only show changes over time on a global scale, but also provide the possibility for users to zoom in to areas of interest, for example any city or region over Europe.
The averaged maps also reflect the effects of the COVID-19 lockdown – with drastic reductions of nitrogen dioxide concentrations visible over many areas. These effects can now be easily explored across the globe.
Nitrogen dioxide concentrations in our atmosphere vary widely on a day-to-day basis owing to the fluctuations of emissions, as well as variations in weather conditions such as sunlight, temperature and wind, all of which can affect the lifetime of the gas in the atmosphere.
Continue reading at European Space Agency
Image via European Space Agency


