
Space agencies in the United States, Japan, and the European Union have collaborated to create a new tool that visualizes environmental changes during the Covid-19 pandemic, from air and water quality, to greenhouse gases, to agriculture.
Space agencies in the United States, Japan, and the European Union have collaborated to create a new tool that visualizes environmental changes during the Covid-19 pandemic, from air and water quality, to greenhouse gases, to agriculture. The system uses data from 17 satellites, monitoring 30 environmental indicators, 17 economic signals, and three agricultural indices.
“When we began to see from space how changing patterns of human activity caused by the pandemic were having a visible impact on the planet, we knew that if we combined resources, we could bring a powerful new analytical tool to bear on this fast-moving crisis,” Thomas Zurbuchen, associate administrator for NASA’s Science Mission Directorate, said in a statement. NASA worked with the European Space Agency and the Japan Aerospace Exploration Agency to create the new tool.
The tool — known as the Covid-19 Earth Observation Dashboard — allows users to track things such as carbon dioxide emissions, light pollution, airport activity, population, land productivity, and suspended matter and chlorophyll concentrations in waterbodies. Most of the information can be examined at either a global, regional, or local level.
Read more at Yale Environment 360
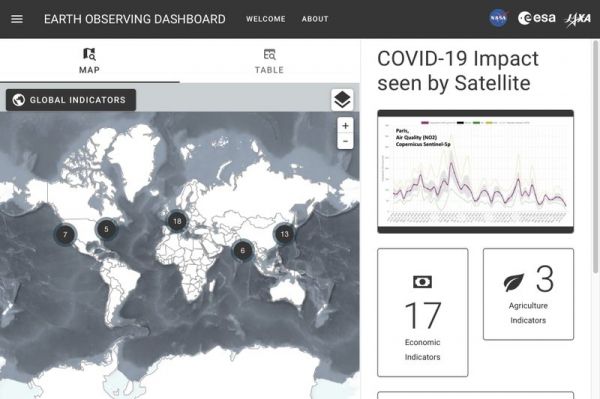
Image: The new Covid-19 Earth Observation Dashboard allows users to track changes in air and water quality, climate change, economic activity, and agriculture. NASA, ESA, JAXA


