
Tropical Depression 8E developed on July 20 and quickly organized into a tropical storm.
Tropical Depression 8E developed on July 20 and quickly organized into a tropical storm. Infrared NASA satellite imagery revealed that Tropical Storm Douglas contained strong storms and showed banding of thunderstorms around its center.
Tropical Depression 8E formed about 905 miles (1,460 km) southwest of the southern tip of Baja California, Mexico by 11 a.m. EDT on July 20. Within 12 hours, 8E had strengthened into a tropical storm and was renamed Douglas.
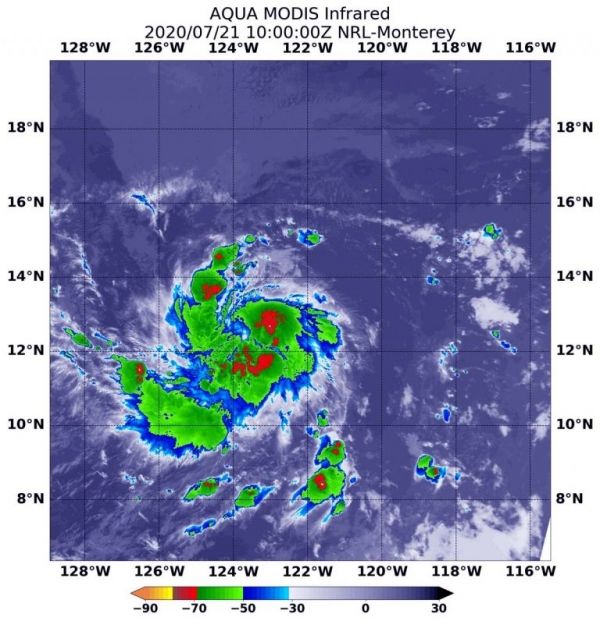
On July 21 at 6 a.m. a.m. EDT (1000 UTC), the Moderate Resolution Imaging Spectroradiometer or MODIS instrument aboard NASA’s Aqua satellite analyzed Douglas’ cloud tops in infrared light. Infrared data provides temperature information, and the strongest thunderstorms that reach high into the atmosphere have the coldest cloud top temperatures.
The National Hurricane Center (NHC) noted that Douglas’ center is also now embedded beneath a central dense overcast (a large central area of thunderstorms surrounding its circulation center) in infrared imagery, near an area of cold overshooting cloud tops. Aqua found several areas of strong storms around the center of Douglas’ circulation and in broken bands of thunderstorms wrapping into that low-level center. In those areas, temperatures were as cold as or colder than minus 70 degrees Fahrenheit (minus 56.6 Celsius). Cloud top temperatures that cold indicate strong storms with the potential to generate heavy rainfall.
Read more at NASA / Goddard Space Flight Center
Image: On July 21 at 6 a.m. EDT (1000 UTC), the MODIS instrument aboard NASA’s Aqua satellite gathered temperature information about Tropical Storm Douglas’ cloud tops. MODIS found several areas of powerful thunderstorms (red) where temperatures were as cold as or colder than minus 70 degrees Fahrenheit (minus 56.6 Celsius). Credit: NASA/NRL


