
When NASA’s Aqua satellite passed over the North Atlantic Ocean, it gathered water vapor data on Isaias, while NASA-NOAA’s Suomi NPP satellite provided forecasters with a visible image that showed a more organized tropical cyclone.
When NASA’s Aqua satellite passed over the North Atlantic Ocean, it gathered water vapor data on Isaias, while NASA-NOAA’s Suomi NPP satellite provided forecasters with a visible image that showed a more organized tropical cyclone.
A Visible View of Isaias
NASA-NOAA’s Suomi NPP satellite passed over the Atlantic Ocean during the afternoon on July 30, the Visible Infrared Imaging Radiometer Suite (VIIRS) instrument provided forecasters with a visible image of Isaias as it was intensifying. VIIRS revealed strong thunderstorms had circled the center of circulation. The image showed the center near the northeastern coast of the Dominican Republic and bands of thunderstorms from the eastern quadrant stretching over Puerto Rico. At the time of the image, Isaias had not yet reached Turks and Caicos. A thick band of thunderstorms from the center of circulation also stretched out in a southwesterly direction and over the Caribbean Sea.
Water Vapor Imagery Reveals Heavy Rainfall Potential
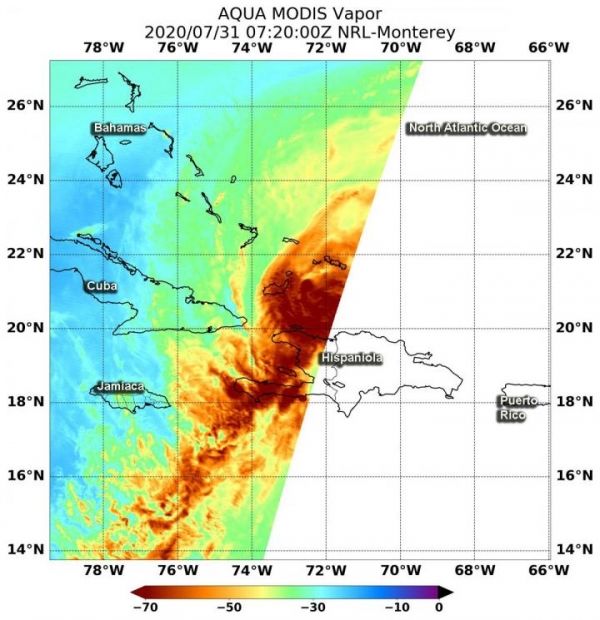
Water vapor analysis of tropical cyclones tells forecasters how much potential a storm has to develop. Water vapor releases latent heat as it condenses into liquid. That liquid becomes clouds and thunderstorms that make up a tropical cyclone. Temperature is important when trying to understand how strong storms can be. The higher the cloud tops, the colder and stronger the storms.
Read more at NASA/Goddard Space Flight Center
Image: On July 31 at 3:20 a.m. EDT (0720 UTC), NASA's Aqua satellite passed over Hurricane Isaias as it departed Hispaniola. Aqua found highest concentrations of water vapor (brown) and coldest cloud top temperatures were around the center. (Credit: NASA/NRL)


