
A civil and environmental engineering researcher at the University of Massachusetts Amherst has, for the first time, assimilated satellite information into on-site river measurements and hydrologic models to calculate the past 35 years of river discharge in the entire pan-Arctic region.
A civil and environmental engineering researcher at the University of Massachusetts Amherst has, for the first time, assimilated satellite information into on-site river measurements and hydrologic models to calculate the past 35 years of river discharge in the entire pan-Arctic region. The research reveals, with unprecedented accuracy, that the acceleration of water pouring into the Arctic Ocean could be three times higher than previously thought.
The publicly available study, published recently in “Nature Communications,” is the result of three years of intensive work by research assistant professor Dongmei Feng, the first and corresponding author on the paper. The unprecedented research assimilates 9.18 million river discharge estimates made from 155,710 orbital satellite images into hydrologic model simulations of 486,493 Arctic river reaches from 1984-2018. The project and the paper are called RADR (Remotely-sensed Arctic Discharge Reanalysis) and was funded by NASA and National Science Foundation programs for early career researchers.
“We recreated the river discharge information all over the pan-Arctic region. Previous studies didn’t do this,” Feng says. “They only used some gauge data and only for certain rivers, not all of them, to calculate how much water is pouring into the Arctic Ocean.”
“This is a new, publicly available daily record of flow across the global North,” adds Colin Gleason, civil and environmental engineering professor and principal investigator on the study. “No one has ever tried to do it at this scale: teaching the models what the satellites saw daily in half a million rivers from millions of satellite observations. It’s a very sophisticated data assimilation, which is the process of merging models and data.”
Read more at: University of Massachusetts Amherst
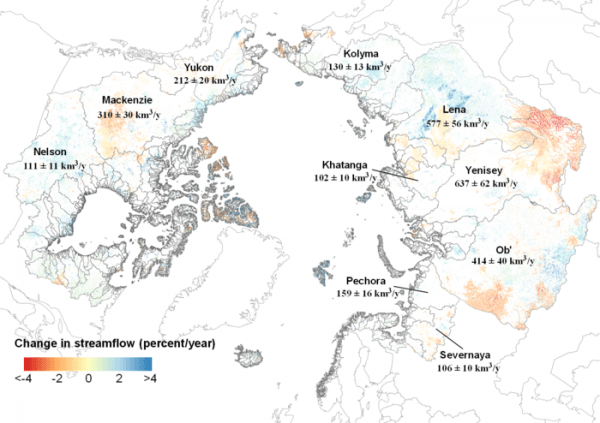
Temporal trends in river discharge during 1984-2018 show significant regional differences in river discharge patterns. Areas in blue indicate increases in discharge of up to 4%, while those in red show decreases of up to 4%. The chart illustrates that significant portions of Eurasia show decreases in streamflow over the past 35 years. Only rivers with statistically significant trends are mapped. (Photo Credit: Dongmei Feng, et al)


