
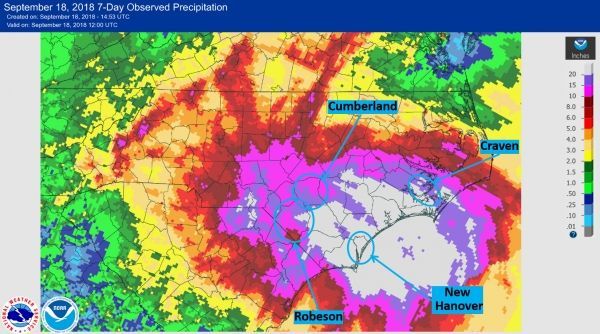
As anticipated, Hurricane Florence resulting in monumental rainfall totals, particularly across southern and eastern North Carolina. This past week’s rainfall totals are depicted in Figure 1, derived from the NOAA/National Weather Service Advanced Hydrologic Prediction Service (AHPS). Widespread totals exceeded 10” across most of southern/eastern North Carolina and far eastern South Carolina, with maximum rainfall of more than 20” along and within a few counties of the Atlantic Coast.
As anticipated, Hurricane Florence resulting in monumental rainfall totals, particularly across southern and eastern North Carolina. This past week’s rainfall totals are depicted in Figure 1, derived from the NOAA/National Weather Service Advanced Hydrologic Prediction Service (AHPS). Widespread totals exceeded 10” across most of southern/eastern North Carolina and far eastern South Carolina, with maximum rainfall of more than 20” along and within a few counties of the Atlantic Coast.
The extreme rainfall dramatically impacted the soil moisture, which underwent a substantial transformation from very dry to near-saturation across south-eastern North Carolina. Figure 2 shows soil moisture retrievals before and after Hurricane Florence from NASA’s Soil Moisture Active Passive (SMAP) mission, which estimates near-surface soil moisture (~top 5 cm) in near-real-time derived from passive microwave satellite observations. A 6-day animation of hourly SPoRT-LIS simulated 0-100 cm relative soil moisture images overlaid with Multi-Radar Multi-Sensor rainfall contours (Fig. 3) nicely shows how the predominantly very dry soils across North and South Carolina prior to Florence were quickly moistened to near saturation over just a few days. [Ongoing research at SPoRT seeks to further improve the experimental soil moisture estimates by assimilating SMAP retrievals into the SPoRT-LIS framework.]
Read more at NASA
Image: Weekly total rainfall (inches), valid 11-18 September 2018, from the National Weather Service Advanced Hydrologic Prediction Service (AHPS) product. Four counties are denoted, for which soil moisture histogram animations are shown later in this article. CREDIT: NOAA


