
NASA’s Aqua satellite analyzed Hurricane Paulette’s water vapor content as it continued to move away from Bermuda and found structural changes, the strongest side, and dry air moving in.
Water vapor analysis of tropical cyclones tells forecasters how much potential a storm has to develop. Water vapor releases latent heat as it condenses into liquid. That liquid becomes clouds and thunderstorms that make up a tropical cyclone. Temperature is important when trying to understand how strong storms can be. The higher the cloud tops, the colder and stronger they are.
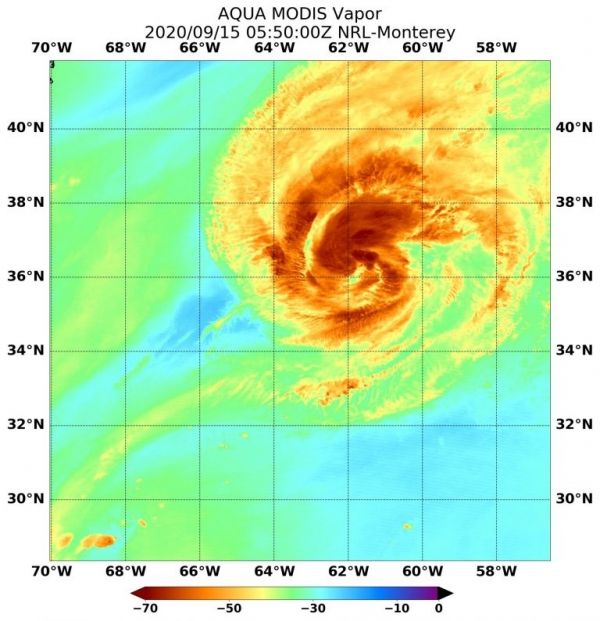
The Moderate Resolution Imaging Spectroradiometer or MODIS instrument aboard NASA’s Aqua satellite gathered water vapor content and temperature information on Paulette on Sept. 15 at 3:25 a.m. EDT (0725 UTC). The MODIS data showed highest concentrations of water vapor and coldest cloud top temperatures were north of the center of circulation. That area had coldest cloud top temperatures that were as cold as or colder than minus 70 degrees Fahrenheit (minus 56.6 degrees Celsius) in those storms. Storms with cloud top temperatures that cold have the capability to produce heavy rainfall.
Continue reading at NASA Goddard Space Flight Center
Image via NASA Goddard Space Flight Center


