A new modeling study, published in the journal Nature Climate Change, suggests that the East Antarctic Ice Sheet may be more resilient to extreme long-term warming than previously estimated.
A new modeling study, published in the journal Nature Climate Change, suggests that the East Antarctic Ice Sheet may be more resilient to extreme long-term warming than previously estimated. Increased snowfall, greater cloud cover, and changes in atmospheric circulation could partially offset ice loss—even under very high carbon dioxide concentrations.
Researchers from the IBS Center for Climate Physics at Pusan National University in South Korea conducted idealized simulations with different atmospheric CO2 levels, spanning 100,000 years using a coupled global climate–ice-sheet model. Unlike conventional studies that prescribe atmospheric and oceanic conditions, the model allowed climate and the Greenland and Antarctic ice sheets to evolve together.
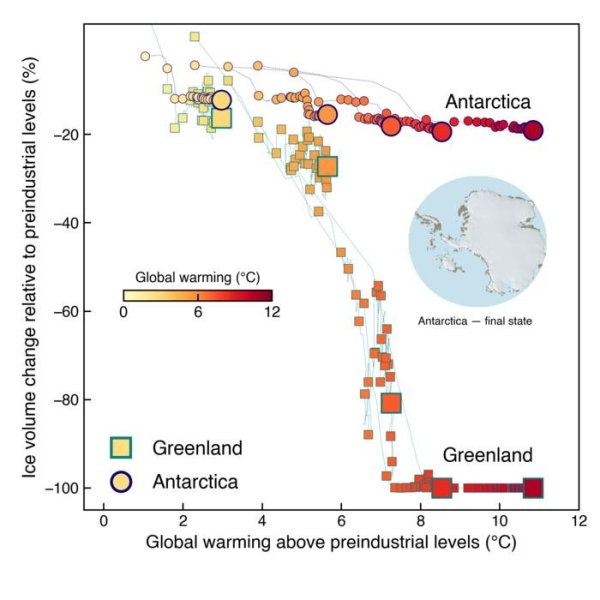
The results reveal striking regional contrasts. Sustained global warming above approximately 2°C relative to preindustrial conditions leads to major long-term ice loss from the marine-based West Antarctic Ice Sheet. Greenland retreats progressively and disappears completely when warming exceeds approximately 6°C. The terrestrial East Antarctic Ice Sheet, however, remains comparatively stable even at warming levels exceeding 10°C in the simulations (Figure 1).
The researchers traced this unexpected resilience to atmospheric processes. Warmer air will carry more moisture toward Antarctica, while a poleward shift in the Southern Hemisphere westerly winds strengthens moisture transport toward the continent. Much of this additional precipitation falls as snow over the high East Antarctic interior, increasing ice accumulation.
Read More: Institute for Basic Science
Image: Long-term response of the Greenland and Antarctic ice sheets to global warming. Ice volume changes are expressed as percentages relative to preindustrial conditions. Circles represent the Antarctic ice sheet, while squares represent the Greenland ice sheet. Symbol shading indicates global mean temperature changes relative to preindustrial conditions, and larger symbols mark the final states of each simulation. The inset map shows Antarctica’s final ice-sheet configuration under high-CO₂ conditions. (Credit: Institute for Basic Science)